
January Audience Insights: Viewers Find More Time for TV
![]() 02.18.2021
02.18.2021 ![]() David Gustafson
David Gustafson![]()
Elton John once crooned that “every month means a little something, but January is the month that cares.”
January 2021 gave TV viewers plenty to care about, as we looked ahead to new beginnings, watched unbelievable events unfold in real time, and harkened back to the previous January when life was more normal – or at least different.
Coming off a 2020 that saw TV viewing spike, ebb, and flow, January 2021 flipped the page to new questions around whether this year will signal continued change in viewing patterns or a return to more conventional trends.
One month in, the answers are far from clear – but here are a few things we learned from last month:
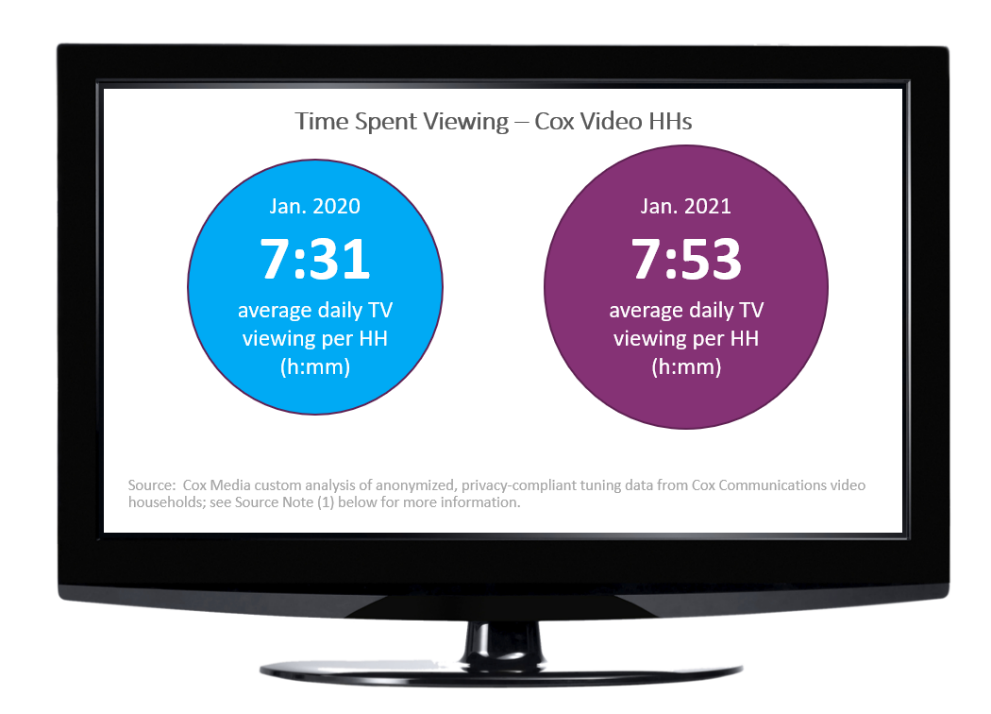
1. COX VIDEO HOMES FOUND EVEN MORE TIME FOR TV VIEWING
During the pre-pandemic period of January 2020, Cox video households tuned in for a daily average of 7 hours, 31 minutes (7:31) of TV viewing time, according to Cox Media analysis of Comscore custom data. For January 2021, that daily average jumped to 7 hours, 53 minutes (7:53) – which translates to more than two-and-a-half additional hours of TV viewing time each week! With a slight uptick from the December 2020 average, January 2021 marked the seventh consecutive month of increased viewing time among Cox video homes.(1)
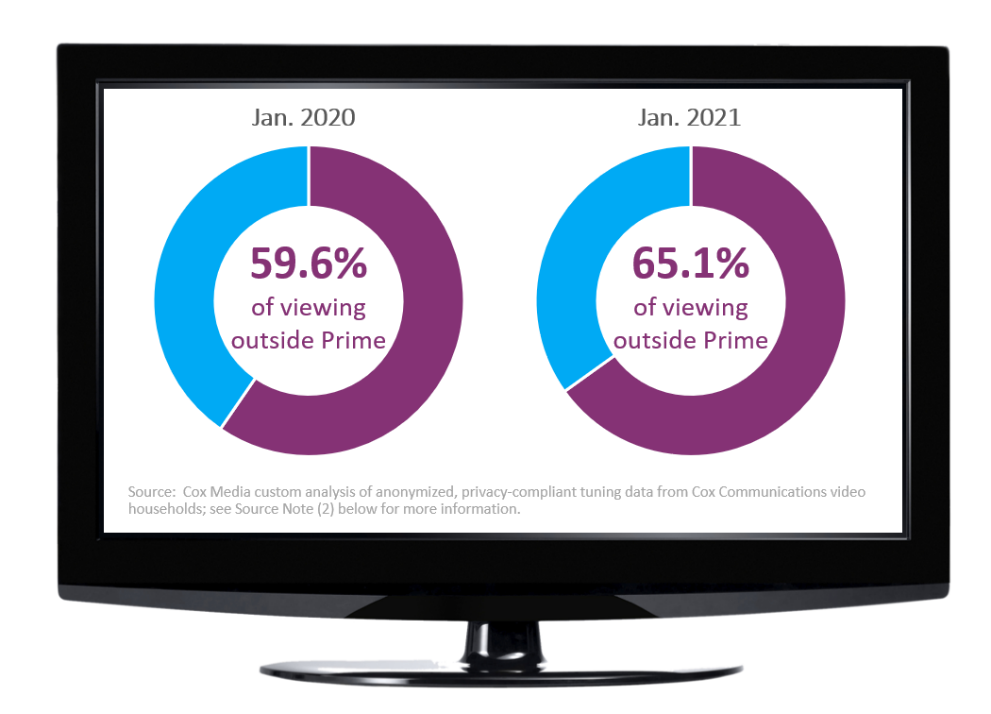
2. LARGER SLICE OF THE VIEWING PIE FELL OUTSIDE OF PRIME
Based on that same custom analysis of Comscore data, the increase in TV viewing time within Cox video homes drove a change in the distribution of viewing throughout the day. For January 2020, more than 40% of total viewing time in Cox homes took place in the evening quadrant, between the hours of 6 p.m. and midnight. For January 2021, the evening share of viewing dropped below 35%, as the morning (+2.8 points YOY) and overnight (+2.1) quadrants each gained significant share of total-day viewing time among Cox video homes. As a result, nearly two-thirds of the January 2021 viewing time fell outside the evening quadrant that includes the traditional primetime hours.(2)
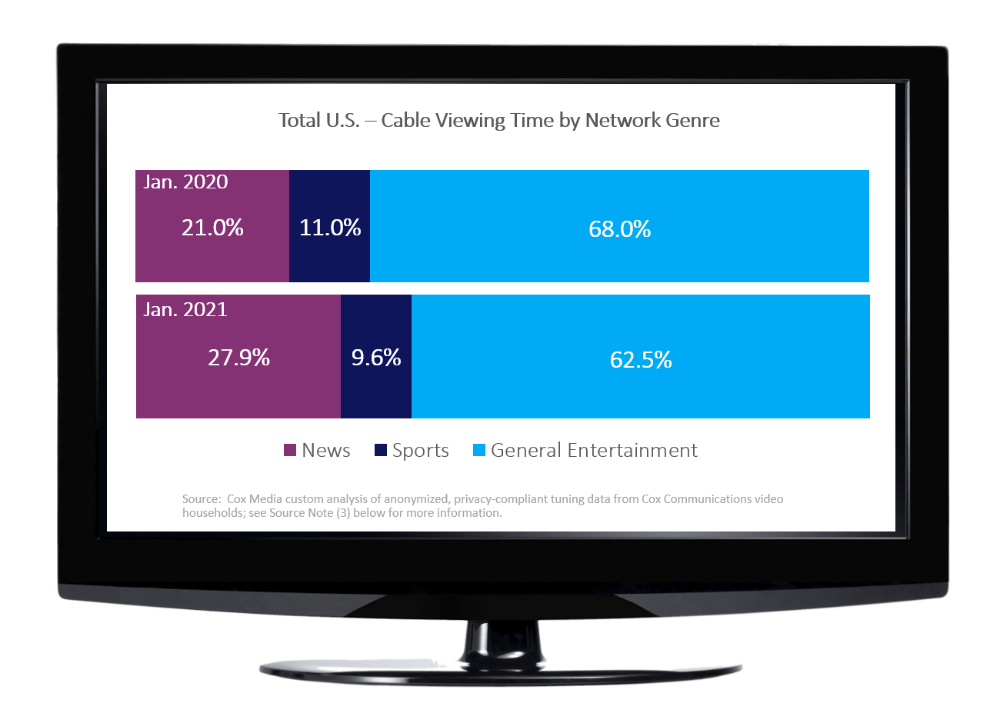
3. NATIONALLY, NEWS CONTINUED TO CAPTURE AN ELEVATED SHARE OF CABLE VIEWING
From insurrection to inauguration, last month’s events on Capitol Hill undoubtedly influenced Cable TV viewing at the national level. Based on Cox Media analysis of Comscore syndicated data for January 2021, Cable viewers spent nearly 17 minutes out of every viewing hour tuned to Cable news networks – an increase of more than four minutes per hour compared to January 2020. Share of viewing for Cable sports networks, meanwhile, was down from January 2020 levels. Despite the year-over-year decline, Cable sports networks increased viewing share among Cable viewers for the third straight month, as live sports continue to find consistency.(3)
In a recently revised forecast, industry prognosticator eMarketer predicts that, once 2021 has come and gone, the average U.S. adult will have spent 13 hours, 27 minutes (13:27) each day consuming media. That forecast is down about 11 minutes per day compared to the final 2020 estimate.(4)
In the words of the Grateful Dead, though, “every silver lining’s got a touch of grey.” The revised 2021 forecast still means average media consumption will be up almost a full hour per day compared to pre-pandemic levels from 2019. And Cox Media’s combination of TV and TV Everywhere video solutions are expected to account for more than five-and-a-half hours of that daily media consumption.
We’ll be back next month with more TV trends. Until then, stay tuned to coxmedia.com for helpful advertising tips and additional insights.
Sources
1, Cox Media custom analysis of anonymized, privacy-compliant tuning data from Cox Communications video households, aggregated across full footprint; data processed by Comscore and accessed via TV Essentials platform; live linear TV; total day (6a-6a); monthly totals averaged based on number of days in broadcast month.
2. Cox Media custom analysis of anonymized, privacy-compliant tuning data from Cox Communications video households, aggregated across full footprint; data processed by Comscore and accessed via TV Essentials platform; live linear TV; analysis based on four daypart quadrants – M-Su 6a-12n, 12n-6p, 6p-12m, 12m-6a.
3. Cox Media analysis of Comscore syndicated national viewing estimates via TV Essentials; Total HH Hours Viewed; Live; Jan. 2020 and Jan. 2021 broadcast months; regional sports networks not included.
4. Cox Media analysis of eMarketer’s “US Time Spent with Media 2021 Update” released February 2020.
Connect with a Marketing Expert
Share Post On Social
Connect With Your Local Marketing Expert
You know your business. We know advertising. Together, we can bring your business to more people. Contact a member of our team today. We’d love to help you grow.