
April Audience Insights: With More Americans at Home, TV Trends Up, Basketball Bounces Back & Streaming Surges
![]() 05.11.2020
05.11.2020 ![]() David Gustafson
David Gustafson![]()
April was atypical in many ways, as nine out of 10 Americans adjusted to life under some sort of shelter-in-place or stay-at-home order. Not surprisingly, more time at home translated to less time on the road. Americans’ average mobility in terms of miles traveled was cut almost in half in April, according to Cox Media analysis of data from Unacast’s Social Distancing Scoreboard. Similarly, according to Reuters, US demand for gasoline declined more than 40% last month.
While decreased travel time meant less exposure to radio, billboards, and other out-of-home media, Americans accelerated their in-home media consumption – so much so that market research firm eMarketer recently upgraded its 2020 forecast to reflect an additional hour per day of average media consumption for every adult in the country. eMarketer credits TV and digital video as key contributors to the change, collectively accounting for nearly six hours of daily time spent per US adult, an increase of approximately 40 minutes per day compared to 2019 levels.
With that backdrop, here now is a closer look at six ways America’s viewing habits changed in April 2020:
1. TV CONTINUED TO ATTRACT LARGER AUDIENCES
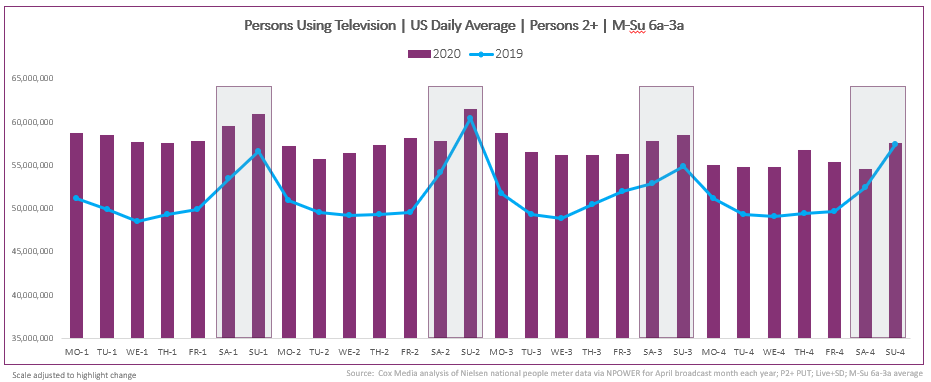
After a rapid rise in viewership during the second half of March, TV maintained consistently high year-over-year audience gains in April, as Americans settled in to new routines at home. Based on Cox Media analysis of Nielsen national data, the overall US TV audience exceeded last year’s viewing levels for each of the 28 days of the April broadcast month. For the month as a whole, the average total-day TV audience was up more than 11% vs. April 2019.(1)
2. DAYTIME DREW THE BIGGEST INFLUX OF APRIL VIEWERS
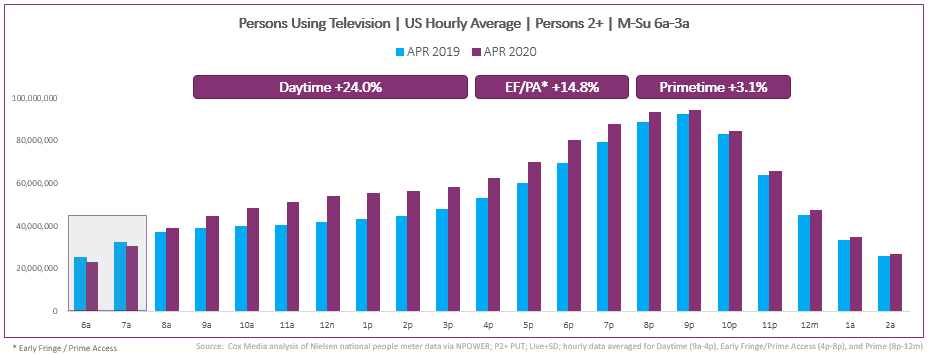
TV audience levels increased throughout the day in April. Based on Cox Media analysis of Nielsen data, daytime viewing continued to see the biggest lift, up 24% vs. April 2019. Audience levels during late afternoon and early evening hours grew 15% over last year, while the primetime audience bumped up 3%. Early morning viewing was a noticeable outlier, with declines in the 6 a.m. and 7 a.m. hours perhaps indicating that many Americans were able to trade morning commutes for some additional sleep.(2)
3. WEEKDAYS WELCOMED THE MOST ADDITIONAL AUDIENCE
Cox Media’s analysis of Nielsen data found that the April’s average Monday-Friday television audience increased nearly 14% vs. April 2019, outpacing TV’s otherwise impressive 6% weekend audience gains. By month-end, the average weekday viewing audience for April 2020 actually exceeded the April 2019 weekend average by almost 3%.(3)
4. SPORTS VIEWERS STAYED IN THE TV GAME
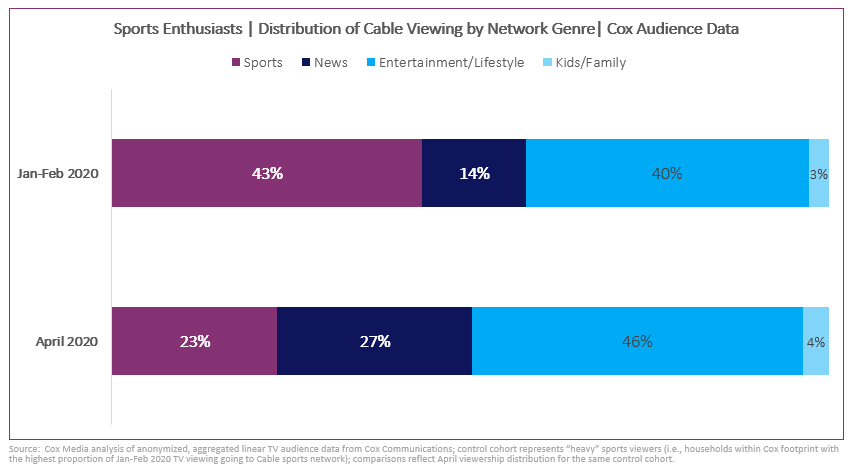
With most live sports programming on pause, audience levels for Cable’s 24-hour sports networks have declined. Perhaps surprisingly, though, sports enthusiasts actually spent more time watching TV in April. Based on Cox Media analysis of Cox Communications audience data, homes with the highest proportion of sports viewing during the first two months of 2020 increased their average ad-supported Cable viewing by more than 12% last month. As those sports enthusiasts watched more, the composition of their Cable viewing also changed. Cable news networks benefitted most from the shift, garnering nearly double the share of viewing from sports enthusiasts in April vs. January-February 2020 averages.(4)
5. FIRST STEPS OF “LAST DANCE” BROUGHT BASKETBALL BACK
In April 2019, nine NBA postseason games ranked among the month’s top 10 ad-supported Cable telecasts within the key Adults 18-49 demographic. With no live NBA games this April, ESPN went back in time and found a hardwood hit with “The Last Dance,” a 10-part documentary chronicling the 1997-1998 Chicago Bulls team led by Michael Jordan. The first four episodes premiered last month, and all four landed in Cable’s top five for April among Adults 18-49. ESPN’s first-round coverage of the NFL Draft once again was April’s top Cable telecast in the 18-49 demographic – securing nearly 60% more viewers in that age range, compared to first-round draft coverage in April 2019.(5)

6. STREAMING VIDEO SUSTAINED SURGE IN POPULARITY
With Americans home more in April with access to more devices, the amount of time spent with OTT/streaming video content continued to grow rapidly. Based on Cox Media analysis of Nielsen national data, the average weekly streaming minutes for April increased nearly 16% compared to March – more than doubling the April 2019 weekly average. Comscore credits the rising popularity of connected TVs as a big part of the streaming surge, estimating that nearly three-quarters of homes with wi-fi now have a streaming-enabled TV set.(6)

Moving into May, at least 30 states have partially reopened, with others following close behind. As Americans cautiously begin to venture outside their homes more often, some of the specific video consumption changes from April could begin to change. At a macro level, though, eMarketer predicts that the country’s rediscovery of media multitasking will fuel a prolonged period of increased usage. The company’s new multi-year forecast shows the average American spending 45 more minutes each day consuming media in 2022 than had been previously forecast for 2020.
Visit coxmedia.com for continuing coverage, analysis, and support.
SOURCING
- Cox Media analysis of Nielsen national people meter data via NPOWER for April 2020 broadcast month (3/30/2020-4/26/2020); Persons Using Television (PUT); Persons 2+; Live+SD; M-Su 6a-3a average.
- Cox Media analysis of Nielsen national people meter data via NPOWER for April 2020 broadcast month; PUT; Persons 2+; Live+SD; M-Su 6a-3a hourly data averaged for Daytime (9a-4p), Early Fringe/Prime Access (4p-8p), and Primetime (8p-12m).
- Cox Media analysis of Nielsen national people meter data via NPOWER for April 2020 broadcast month; PUT; Persons 2+; Live+SD; M-Su 6a-3a data averaged by day of week.
- Cox Media analysis of anonymized, aggregated linear TV audience data from Cox Communications; control cohort represents “heavy” sports viewers (i.e., households within Cox footprint with the highest proportion of Jan-Feb 2020 TV viewing going to Cable sports network); comparisons reflect April viewership distribution for the same control cohort.
- Cox Media analysis of Nielsen national people meter data via NPOWER for April 2020 broadcast month; Total US average audience; Persons 18-49; Live+SD; M-Su 6a-3a data filtered for ad-supported Cable networks.
- Cox Media analysis of Nielsen national weekly streaming summary data. Comscore OTT Intelligence data from 4/30/2020 client webinar on connected TV advertising.
Connect with a Marketing Expert
Share Post On Social
Connect With Your Local Marketing Expert
You know your business. We know advertising. Together, we can bring your business to more people. Contact a member of our team today. We’d love to help you grow.