
March-ing to a Different Beat: How TV Viewing & Media Consumption Changed Last Month
![]() 04.20.2020
04.20.2020 ![]() David Gustafson
David Gustafson![]()
Like many of the college basketball games that have come to define the month in previous years, March 2020 was unquestionably a tale of two halves. As the month began, the term “social distancing” had become part of the American lexicon, but implementation of such measures was sporadic. By mid-month, though, the federal government had declared a national emergency in response to the recent health crisis, and multiple states subsequently began to implement stay-at-home orders.
As March ended, the majority of the US population was under some sort of lockdown. In a matter of weeks, millions of Americans went from contending with heavy traffic and long commutes to navigating the nuances of remote work and distance learning. Millions of others faced lingering uncertainty as the definitions of essential and non-essential services continued to evolve.
These societal shifts significantly altered the nation’s TV and media habits as the month progressed. Here is a look back at eight ways media consumption changed during the second half of March:
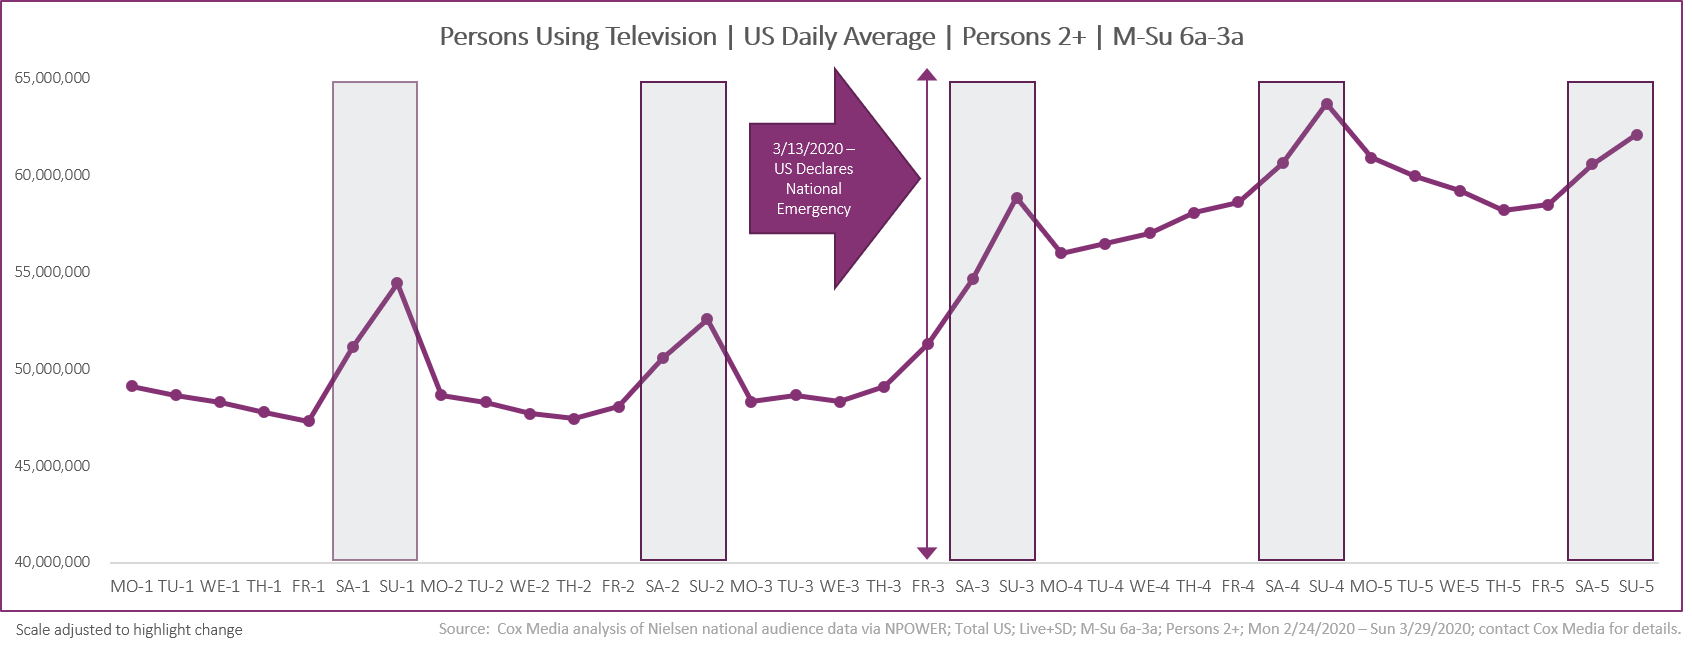
1. MORE VIEWERS TURNED TO TV
The national emergency declaration was announced March 13, and Cox Media analysis of national Nielsen data points to that Friday as a pivotal point for television viewing. Overall TV usage jumped nearly 8% that day, compared to the first two Fridays of the March 2020 broadcast month. Moreover, March 13 marked the first of 14 consecutive days of TV growth vs. same-day previous week (e.g., Monday vs. previous Monday, etc.). By month-end, the post-March 13 TV audience was up 20% vs. pre-March 13 levels.(1)
2. DAYTIME DELIVERED TV’S LARGEST LIFT
The national TV audience increased nearly every hour of the day during the second half of March, based on Cox Media analysis of Nielsen data. With more Americans at home for more hours of the day as the month progressed, non-prime dayparts saw the biggest audience gains. Weekday daytime viewership vaulted 36% vs. the first half of the month, while late afternoon and early evening hours rose more than 20%. The primetime audience grew nearly 12%.(2)
3. YOUNGER VIEWERS PROVIDED THE BIGGEST DAYTIME BOOST
While viewers of all ages contributed to TV audience growth during the second half of March, the daytime increase among viewers under the age of 35 was the most dramatic. Based on Cox Media analysis of Nielsen data, the under-35 average daytime audience increased 40% for Broadcast and nearly 60% for ad-supported Cable.(3)
4. CABLE VIEWERS TUNED IN LONGER
In addition to gaining viewers during the second half of March, ad-supported Cable kept those viewers more engaged. The average number of Cable tuning events per viewer increased nearly 4% vs. the first half of March, and the average viewing time for each of those Cable events was up 2%, based on Cox Media analysis of Nielsen data.(4)
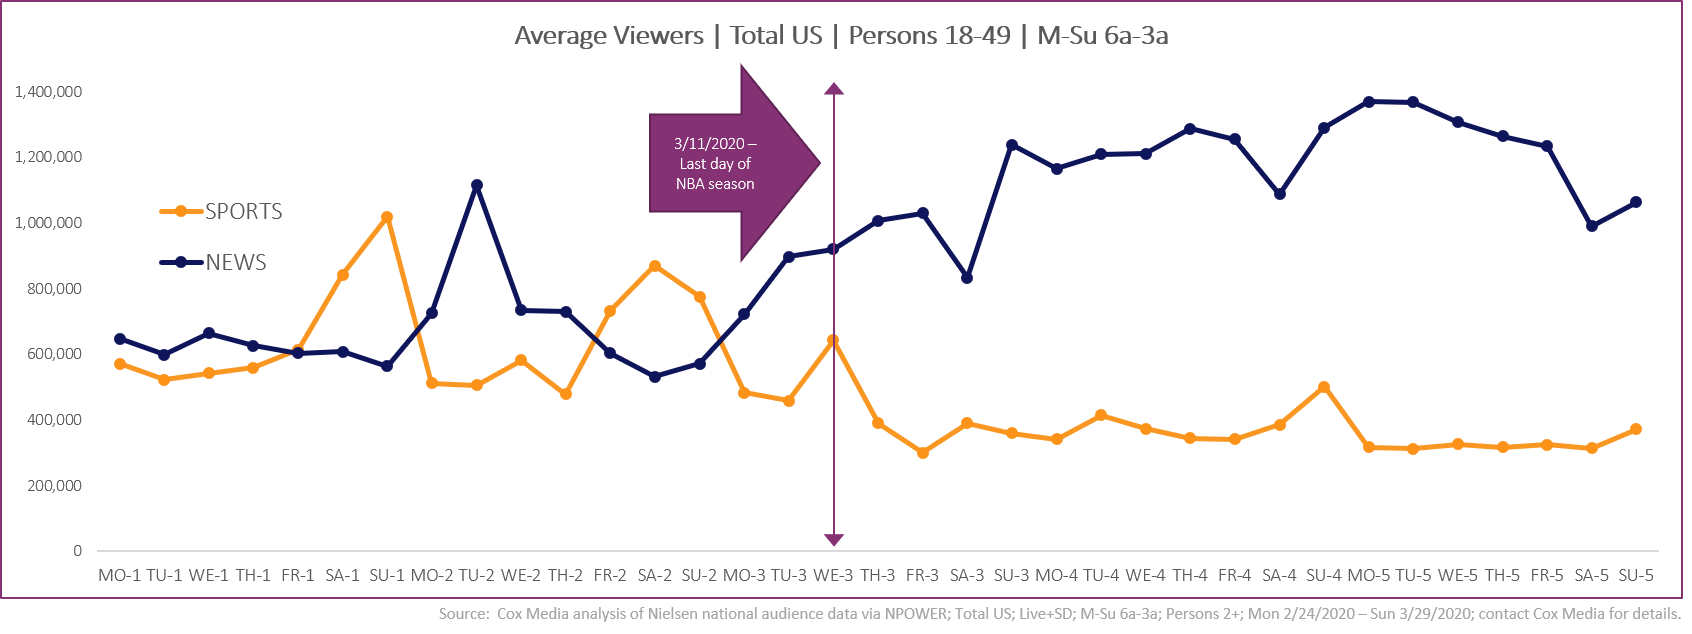
5. WITH SPORTS SUSPENDED, CABLE NEWS BROKE THROUGH
The NBA’s March 11 decision to suspend the remainder of the season set in motion a swift and unprecedented shutdown of major professional and college sports, including the NCAA men’s and women’s college basketball tournaments. With no live games being televised, viewing to Cable Sports networks fell 43% during the second half of March among adults 18-49 years of age. Conversely, the escalated need for real-time crisis updates elevated Cable News networks to a 69% audience increase in the 18-49 demographic, according to Cox Media analysis of Nielsen data.(5)
6. ON DEMAND WAS IN HIGHER DEMAND
As fitness clubs, movie theaters, and other out-of-home entertainment venues shuttered in March, Americans increasingly sought out Video on Demand (VOD) options. Comscore reports that VOD households averaged more than 16 transactions over the course of the month, an increase of 23% from February – and up nearly 30% vs. March 2019. On a weekly basis, average VOD transactions were relatively flat with 2019 for the second week of the March broadcast month, before rising sharply the next two weeks to a peak of nearly 40% year-over-year growth for the week of March 16-22. Fitness content represented the single biggest growth category, with transactions up 147% vs. March 2019.(6)
7. USE OF OTT/STREAMING SERVICES SURGED
The renewed demand for at-home content also drove tremendous growth in streaming video throughout March. Comscore reported that in-home data usage was pacing at nearly 40% above March 2019 levels, and Nielsen data confirmed that already healthy year-over-year increases in streaming video consumption skyrocketed during the second half of March. Nielsen’s numbers show that the amount of content being streamed to TV sets during the last two weeks of the March broadcast month rose 36% vs. the first half of the month – translating to an overall 87% lift vs. March 2019.(7)
8. ONLINE TRAFFIC TRENDED UPWARD IN KEY CATEGORIES
In addition to the tremendous growth in video consumption across multiple platforms, demand for digital content also increased in March. According to Comscore, apps and websites delivering family and youth education content generated an 80% lift in total visits for the week of March 16-22 vs. the previous week. For that same week, Comscore reports that top US retail sites recorded their highest weekly traffic totals of 2020 to date – as did leading news sites.(8)
Moving into April, the dramatic week-over-week gains for TV, VOD, OTT, and Digital that dominated the latter part of March appear to be leveling off, as Americans have settled into new routines and the demand for content stabilizes. But, with at least 95% of the US population now under some form of stay-at-home order, initial indications point to the “new normal” continuing to fuel significant year-over-year increases in media consumption throughout April – and possibly into May.
Visit coxmedia.com for continuing coverage, analysis, and support.
SOURCING
- Cox Media analysis of Nielsen national people meter data via NPOWER for March 2020 broadcast month (2/24/2020-3/29/2020); Persons Using Television (PUT); Persons 2+; Live+SD; M-Su 6a-3a average.
- Cox Media analysis of Nielsen national people meter data via NPOWER for March 2020 broadcast month; PUT; Persons 2+; Live+SD; M-Su 6a-3a hourly data averaged for Daytime (9a-4p), Early Fringe/Prime Access (4p-8p), and Primetime (8p-12m).
- Cox Media analysis of Nielsen national people meter data via NPOWER for March 2020 broadcast month; PUT for Persons 2-34, 35-64 and 65+; Live+SD; M-Su 6a-3a hourly data averaged for Daytime (9a-4p), Early Fringe/Prime Access (4p-8p), and Primetime (8p-12m); Broadcast and Cable designations reflect Cox Media custom network lists.
- Cox Media analysis of Nielsen national length-of-tune reporting via NPOWER for March 2020 broadcast month; Persons 2+; average events per unique HH/person and average length of tuning events for Nielsen-defined English Ad-Supported Cable Orig standard grouping.
- Cox Media analysis of Nielsen national people meter data via NPOWER for March 2020 broadcast month; P18-49 PUT; Live+SD; M-Su 6a-3a average; Cable News and Cable Sports designations reflect Cox Media custom lists.
- Press Release: “Comscore Shows 30 Percent Year-Over-Year Increase in Video on Demand Transactions” (April 8, 2020)
- Press Release: “Comscore Reports Surging Levels of In-Home Data Usage” (March 24, 2020) – and Cox Media custom analysis of Nielsen weekly streaming data originally cited in Variety.com (March 31, 2020).
- Press Release: “Comscore Finds Continuing Digital Audience Growth for Key Categories” (March 30, 2020).
Connect with a Marketing Expert
Share Post On Social
Connect With Your Local Marketing Expert
You know your business. We know advertising. Together, we can bring your business to more people. Contact a member of our team today. We’d love to help you grow.