Audience Insights: Cable Clings to TV Viewing Crown as CTV Continues to Climb
Earlier in 2022, an Ad Age article on video trends predicted that streaming would become “the fastest growing video format in both viewership and media investment.” Midway through the year, those predictions seem to be well on the way to becoming reality – but traditional linear television is far from being washed away by the stream of new opportunities.
As we take a mid-year look at some of the numbers and nuance shaping the current video landscape, let’s begin with a clarification of key terms used to delineate streaming activity. Based on guidance provided by the Media Rating Council (MRC) in the second half of last year, “Connected TV” (CTV) is now widely accepted as a specific reference to “the delivery of digital video to televisions via internet-connected devices (or functionality within the television itself).”
By that definition, CTV is now considered a subset of the more broadly defined “Over the Top” (OTT), which includes CTV and streaming content delivered to mobile and desktop devices. Within that context, here are six figures to help frame up the overall TV viewing picture as we pass the halfway point of 2022.
(Unless otherwise noted, the streaming stats below refer to the subset of OTT activity classified as CTV.)
- 324 billion – The total monthly hours of “traditional” live and time-shifted television viewing for March 2022 among U.S. TV households, according to Comscore’s recently released State of Streaming report.
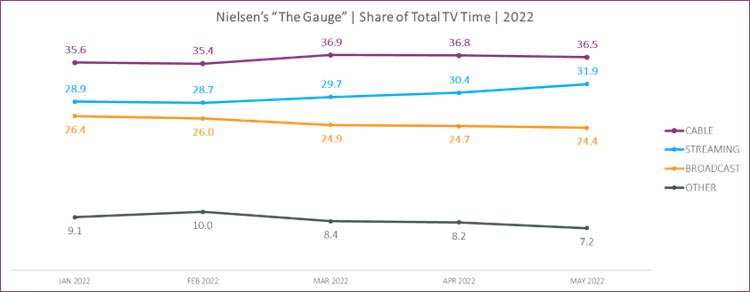
- 1.5 times – The current advantage Cable enjoys over Broadcast in time spent viewing, according to Cox Media analysis of data from The Gauge, a monthly Nielsen “macroanalysis” of video consumption across major TV delivery platforms. Cable currently garners approximately 60% of “traditional” TV time vs. 40% for Broadcast.
- Number 1 – Cable’s continued rank in overall U.S. television viewing time, based on Nielsen’s Gauge Through May 2022, Cable has held steady as the most-viewed TV source. Streaming, meanwhile, has continued to gain share – largely at the expense of Broadcast TV, which has shown slight decline in viewing share each of the first five months of the year.

- 5.7 million more – The year-over-year increase in the number of U.S. households that streamed content to their TV sets, according to the Comscore State of Streaming report. Comscore reports 85.7 active CTV homes for March 2022, compared to approximately 80 million in March 2021.
- 122 hours per month – Average time per household spent streaming content to Connected TVs, based on Comscore’s State of Streaming data for March 2022. That represents a 19% increase in monthly CTV streaming hours vs. March 2021, as the average number of streaming services watched per household has increased from 4.7 to 5.4 during that same period.
- Plus 29% – Growth from March 2020 to March 2022 in the number of CTV streaming households using ad-supported streaming services, according to Comscore’s State of Streaming During the same period, use of non-ad-supported streaming services grew at a comparably lower 21%. As of March 2022, nearly the same number of CTV households use ad-supported streaming services (77.5 million) as use non-ad-supported services (77.7 million).
Add it all up and the conclusion seems clear for the remainder of the year. Cox Media’s robust combination of TV and TV Everywhere advertising solutions will play a critical role in maximizing marketing, branding, and messaging to a broad range of consumers across both traditional and streaming TV content. Contact us today to begin planning your next multi-screen campaign – and stay tuned here for more Audience Insights coming next month.
Connect with a Marketing Expert
Share Post On Social
Related Insights
Connect With Your Local Marketing Expert
You know your business. We know advertising. Together, we can bring your business to more people. Contact a member of our team today. We’d love to help you grow.


