Audience Insights: Islands in the Stream…Is That What We Are?
In their easy-listening classic “Islands in the Stream,” Dolly Parton and the late Kenny Rogers opine about sailing away together to another world. “The message is clear,” they try to convince each other (and perhaps themselves), “this could be the year for the real thing.”
For the better part of 15 years, Netflix has been the undisputed “real thing” in the continually evolving world of streaming video. Recent announcements, though, have caused some industry observers to hit the pause button on the notion of smooth sailing for the streaming giant. During the first quarter of this year, Netflix lost subscribers for the first time in more than a decade – and more declines are expected for second quarter.
The Netflix numbers would be newsworthy on their own – but in the same week, Warner Bros. Discovery announced that the fledgling CNN+ streaming service will permanently move to the minus column. That confluence of events led The Ringer to proclaim April 2022 as “one of the rockiest months of the Streaming Wars in recent memory.”
Despite all of April’s headline-worthy evidence of change, all is not hopelessly choppy in the streaming TV waters. Comscore estimates that 82 million U.S. households now stream content each month, and Nielsen’s recent “State of Play” report asserts that “consumers have spoken, and streaming is here to stay.” With that backdrop, then, this latest installment of our Audience Insights series focuses on five facts that can help frame the streaming discussion:
1. Streaming had its best month ever in March.
According to “The Gauge,” a monthly snapshot produced by Nielsen, U.S. viewers “spent nearly 30% of their total TV time watching over-the-top video content” via streaming services in March 2022. The milestone month represents a full-point increase from February, and March marked the fifth straight month that streaming outperformed Broadcast TV in overall time spent viewing. Cable continued its consistent performance as the #1 viewing source, garnering 37% of total TV time and approximately 60% of linear TV viewing time.
2. Ad-supported streaming services are having a moment.
The Netflix streaming model – at least for the time being – continues to be notably free of advertising, but recent analysis from Comscore indicates that more and more viewers are choosing to watch content from ad-supported streaming services – also referred to as advertising-based video on demand, or AVOD, services. For February 2022, Comscore OTT Intelligence™ data show AVOD services reached more U.S. households (75.3 million) than were reached by Netflix and other non-ad-supported streaming services (74.7 million) that month. Looking ahead, marketing intelligence firm eMarketer projects that the U.S. AVOD viewing audience will grow 8.6% this year and another 7.5% in 2023.
3. Half of active streamers are also Pay TV subscribers.
Based on Cox Media analysis of Comscore OTT Intelligence™ data, approximately four out of five U.S. Internet households streamed video during the month of February. Among those streaming households, nearly 50% were “cord stackers” – i.e., homes also subscribing to traditional Cable and Satellite services – while the remaining half were “cordless.” As a result, adding TV Everywhere options to traditional TV campaigns can shore up messaging among the stackers while expanding reach among the cordless.
4. Streamers are watching content from an increasing number of platforms.
In the April 2022 “State of Play” report, Nielsen tracks what it calls the “explosion – and impact – of streaming choice.” According to Nielsen’s consumer surveys, 35% of video subscribers in 2019 had only one paid streaming service, while less than a third had more than two services. Fast forward to 2022, and nearly six out of 10 video subscribers have three or more paid streaming services. And, according to Comscore, streamers are understandably using what they pay for. Comscore OTT Intelligence™ data for the past three Januarys show the average number of OTT services watched per streaming household has risen steadily – from 4.4 in 2020 to 5.0 in 2021 to 5.5 as of January 2022.
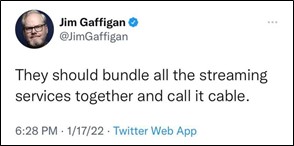
5. Bundling…maybe Jim Gaffigan is on to something.
One obvious result of consumers carrying more streaming subscriptions is paying more each month for those services. Nielsen survey data show that the majority (53%) of streamers now spend at least $20 a month on streaming services, and most (56%) cite cost as the primary reason for not adding more services. Beyond cost, the increasing number of services can make finding content more challenging. Nielsen reports that nearly half (46%) of viewers find it “harder to find the video streaming content they want” – and nearly two-thirds (64%) of viewers “wish there was a bundled video streaming service.” Count comedian and media industry expert Jim Gaffigan among that group…

Regardless of which and how many streaming services consumers ultimately subscribe to, viewers are still the clear winners – the islands in a free-flowing stream of premium content. Bolstered by increased viewer demand for on-demand programming, 2021 saw a record number (559) of scripted original series across Broadcast, Cable, and streaming services, according to data compiled by FX Research. More time spent watching more programs on more ad-supported streaming services means more opportunities for Cox Media advertisers to reach more viewers when combining TV and TV Everywhere solutions!
Follow us here for more Audience Insights updates, and feel free to contact Cox Media with questions or topic suggestions for future posts. Also, check out our recent, related blog on consumer trends in video consumption.
Connect with a Marketing Expert
Share Post On Social
Related Insights
Connect With Your Local Marketing Expert
You know your business. We know advertising. Together, we can bring your business to more people. Contact a member of our team today. We’d love to help you grow.


