
November Audience Insights: TV Viewers Elect to Give Thanks
![]() 12.17.2020
12.17.2020 ![]() David Gustafson
David Gustafson![]()
Never one to shy away from controversial opinions on current affairs, the late comedian George Carlin once offered an intriguing take on the American electoral process. “In America, anyone can become president,” Carlin quipped. “That’s the problem.”
Regardless of whether your party preference skews red, blue, or some shade in between – and no matter if your political leanings leave you on the left side of the aisle, the right side, or more often just rolling in the aisles – two things are likely to be true as we look back at the month that was.
First, you probably had at least a passing interest in this year’s presidential race, as evidenced by the fact that each of the major-party candidates received more votes than any previous presidential candidate in American history. And second, you likely found yourself in front of a television set at some point last month. During the November broadcast month, U.S. households spent nearly 16.4 billion hours watching ad-supported Cable networks – the highest total for any single month this year, according to Cox Media analysis of Comscore data.(1)
Here now is a look back at some of TV’s notable November numbers:
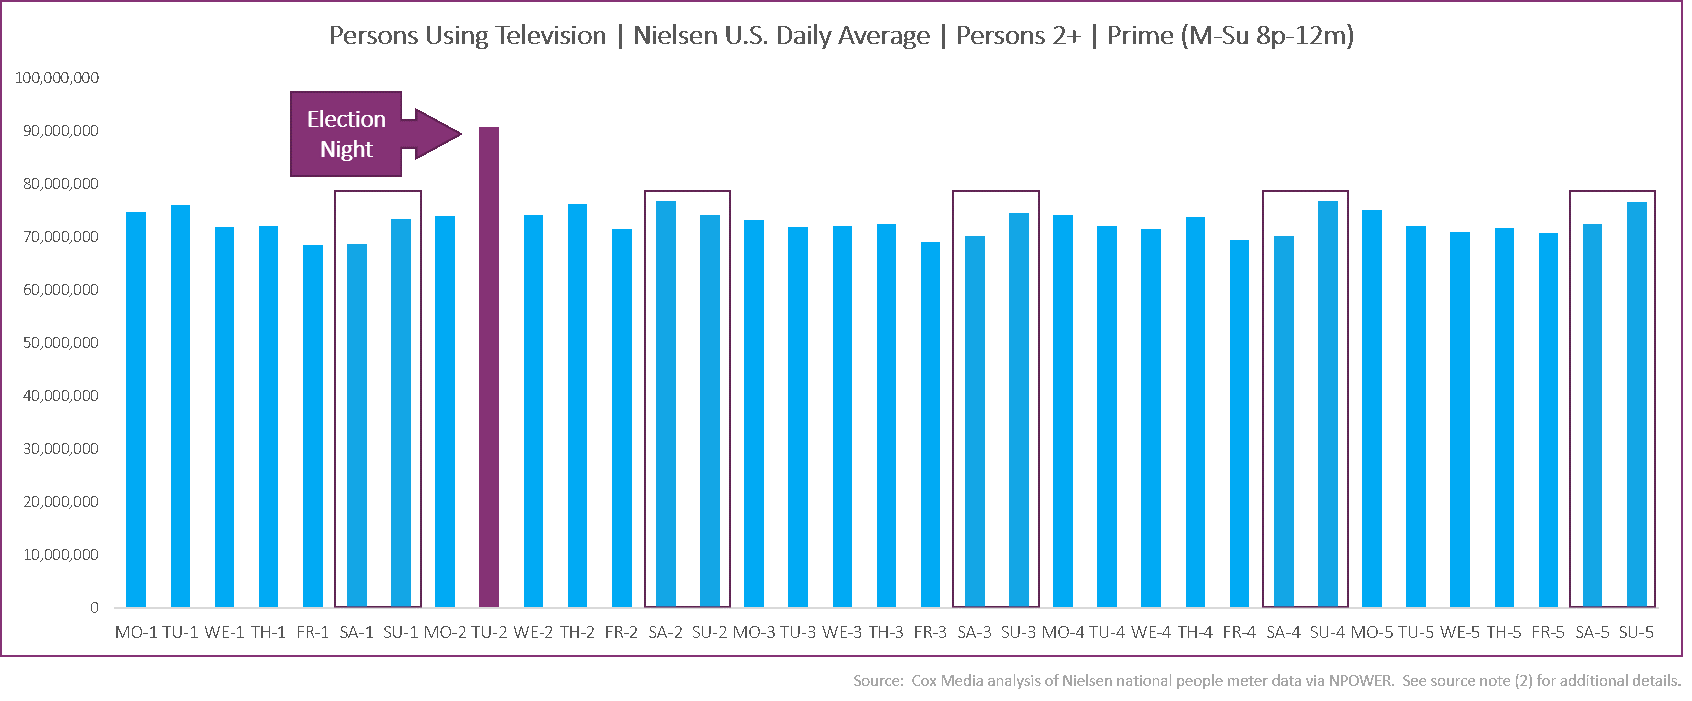
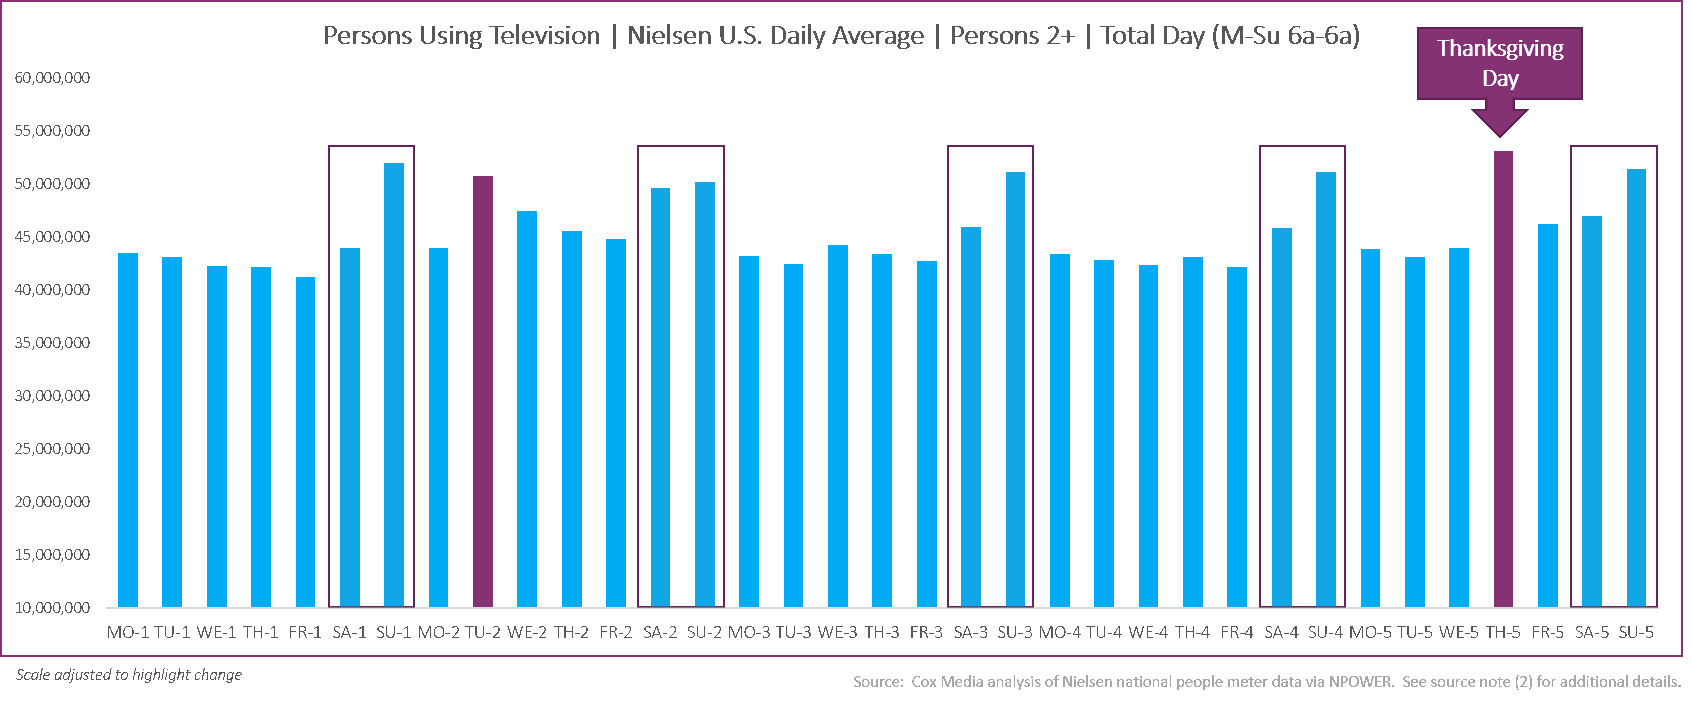
1. ELECTION NIGHT READY FOR PRIME TIME, BUT THANKSGIVING TAKES THE DAY
Bolstered by wall-to-wall election coverage on numerous networks, Tuesday, Nov. 3, scored a clear prime-time victory – drawing more TV viewers than any other night in November. According to Cox Media analysis of national persons-using-television (PUT) data from Nielsen, election night viewing came in nearly 25% above the prime-time average for the remainder of the month.(2)
Even so, there was more on the nation’s collective viewing plate than a heaping helping of precincts and projections. On a total-day basis, Thanksgiving emerged as the overall leader in average viewers – outpacing the average daily viewership for the rest of November by more than 17%.(2)
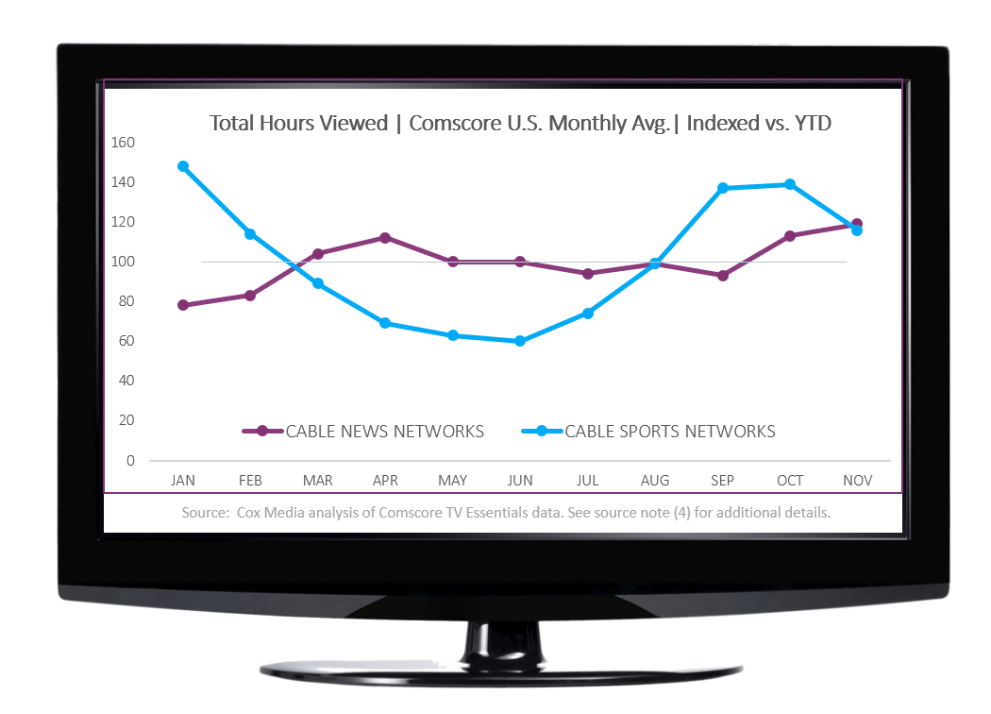
2. NATIONALLY, NEWS AND SPORTS NETWORKS TAKE DIFFERENT PATHS TO SIMILAR PLACE
From a program perspective, politics and pigskin led the way in November. ESPN’s Monday Night Football match-up between the Rams and Buccaneers on Nov. 23 was the month’s most-watched ad-supported Cable telecast among the key 18-49 audience, based on Cox Media analysis of Nielsen data. In fact, all five of ESPN’s Monday NFL games finished in the Top 15 – the only non-election programming to crack the Top 50.(3)
That overall interest in the election coupled with continuing coronavirus coverage propelled Cable news networks to even new heights in November. According to Cox Media analysis of Comscore national data, U.S. households spent more hours per week watching Cable news networks last month than at any point in 2020 – with November finishing 19% above the year-to-date average. The 2020 trajectory for Cable sports networks has been much different, but the popularity of NFL and college football helped November continue a three-month trend of viewing hours exceeding the year-to-date average. While down from an October high that included MLB and NBA playoffs, Cable sports networks still finished November 16% above their 2020 average for hours viewed.(4)
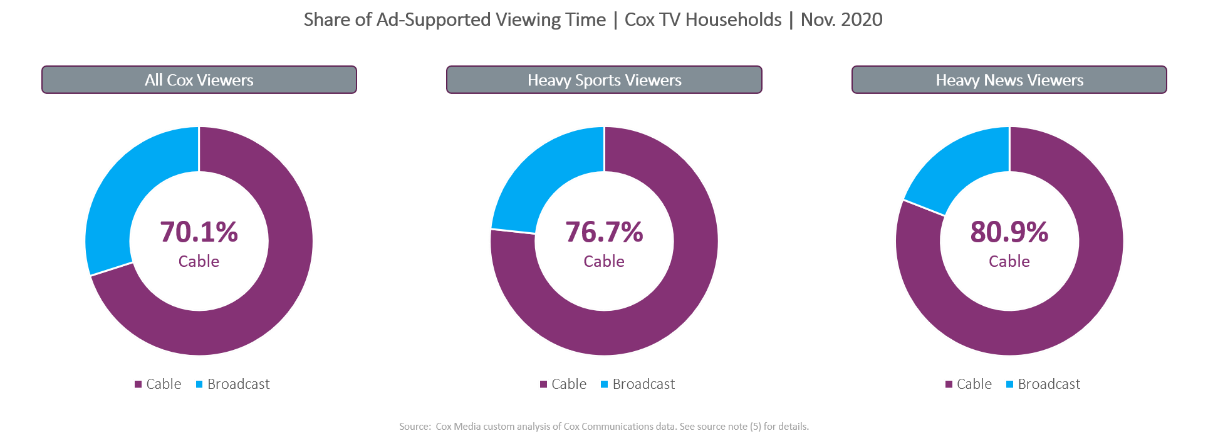
3. IN COX HOMES, NEWS AND SPORTS VIEWERS PREFER CABLE OVER BROADCAST BY WIDE MARGIN
Not surprisingly, Cable news and sports networks were an important of the viewing experience within Cox TV homes, as well. Based on Cox Media custom analysis of Cox Communications data, Cox video homes in general spent significantly more time watching ad-supported Cable than watching Broadcast stations – by more than a 2-to-1 margin in November. Among the heaviest News and Sports viewers in the Cox footprint, though, Cable’s margin vs. Broadcast grew significantly. For November, Sports enthusiasts in the Cox video footprint preferred ad-supported Cable by a 3-to-1 margin, and News connoisseurs chose Cable content by a 4-to-1 margin.(5)
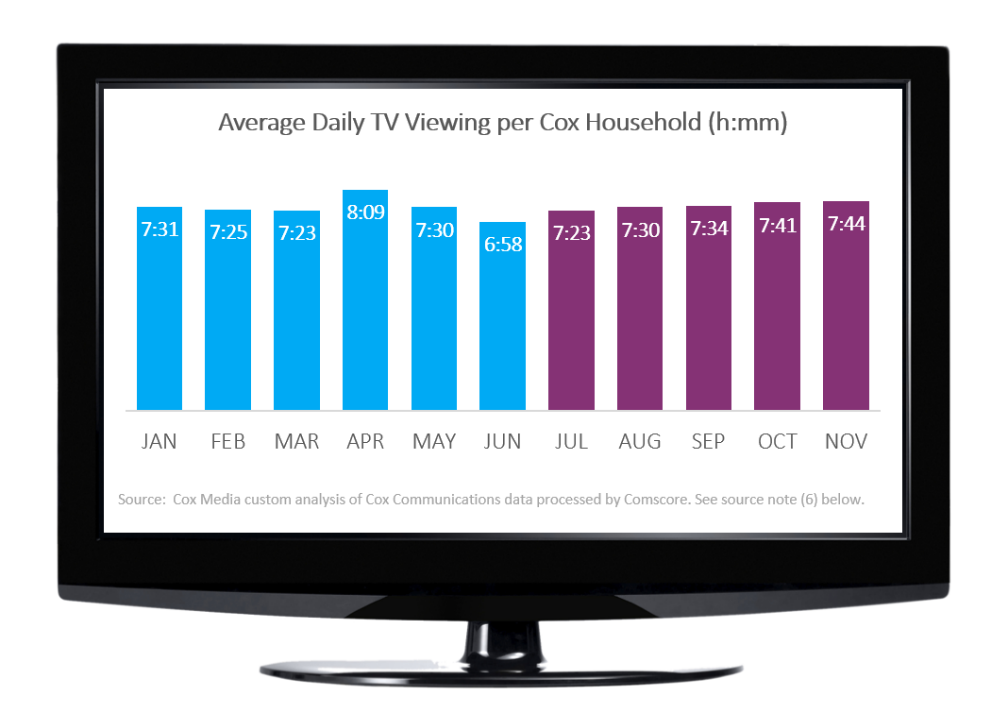
4. TOTAL TIME SPENT VIEWING CONTINUES TO INCREASE IN COX HOMES
Overall for November, Cox video homes tuned in for a daily average of 7 hours, 44 minutes (7:44) of TV viewing time – marking the fifth consecutive month of increased viewing, according to Cox Media custom analysis of Comscore data. November supplanted October as the second-highest month of the year, trailing only April’s stay-at-home peak.(6)
As with politics and sports, pundits and pontificators have already begun predictions for what 2021 will mean for TV and media consumption. Will news networks be able to sustain their reign atop the audience charts? Will sports networks be able to draw more spectators back to the action? Who will win the streaming wars? When will anything get back to normal?
As we close out our last audience insights entry for 2020, we will table those questions for another day. Instead, we return to George Carlin, leaving you with one of his more poignant ponderings. “What if there were no hypothetical questions?”
Have a safe, happy, and healthy holiday season – and be sure to visit coxmedia.com for helpful advertising tips and additional insights.
Source Notes
- Cox Media analysis of Comscore syndicated national viewing estimates via TV Essentials; Total HH Hours Viewed; Live; Jan-Nov 2020 broadcast months; regional sports networks not included.
- Cox Media analysis of Nielsen national people meter data via NPOWER; P2+ PUT; Live+SD; Nov. broadcast month (Mon 10/26-Sun 11/29); comparisons reflect single day vs. average for remaining 34 days in the month; Prime = M-Su 8p-12m; Daytime = M-Su 6a-6a.
- Cox Media analysis of Nielsen national people meter data via NPOWER; P18-49 US AA Proj; Live+SD; Nov. broadcast month (Mon 10/26-Sun 11/29); ad-supported Cable networks; excludes telecasts less than 15 minutes in duration.
- Cox Media analysis of Comscore syndicated national viewing estimates via TV Essentials; Total HH Hours Viewed; Live; Jan-Nov 2020 broadcast months; Index comparisons based on average weekly hours viewed; regional sports networks not included.
- Cox Media custom analysis of anonymized, privacy-compliant linear TV audience data from Cox Communications; control cohorts represents “heavy” Sports and News viewers, respectively (i.e., households within Cox footprint ranking highest for overall viewing to News networks and Sports networks based on Jan-Feb 2020 TV viewing levels); figures reflect distribution of control group’s total viewing time each month.
- Cox Media custom analysis of anonymized, privacy-compliant tuning data from Cox Communications video households, aggregated across full footprint; data processed by Comscore and accessed via TV Essentials platform; live linear TV; total day (6a-6a); monthly totals averaged based on number of days in broadcast month.
Connect with a Marketing Expert
Share Post On Social
Connect With Your Local Marketing Expert
You know your business. We know advertising. Together, we can bring your business to more people. Contact a member of our team today. We’d love to help you grow.