
May Audience Insights: After Astronomical April, May Brings More Moderate Growth for TV and Video
![]() 06.15.2020
06.15.2020 ![]() David Gustafson
David Gustafson![]()
AUTHOR’S NOTE: This is the third installment in our series summarizing monthly audience insights within the context of the continuing public health crisis. Consistent with the previous posts in this series, the remainder of this article focuses on select trends in television and video consumption over the past month. Even in this limited context, though, looking back at May 2020 requires acknowledgment of the broader societal perspective of our nation’s continued fight against the pain and anguish caused by racism and discrimination. Cox Enterprises remains committed to social justice and civil and human rights – because “there is no place for hate of any kind in our society.”
After an atypical April that drove astounding audience growth across the television and video landscape, May marked another month of elevated viewing, as Americans once again adjusted to change.
May began with numerous states rolling out some type of reopening plan. By month end, stay-at-home orders had expired in all but a handful of states, opening up new possibilities amid an atmosphere of cautious optimism. Cox Media analysis of data from Unacast’s Social Distancing Scoreboard shows Americans’ average mobility in terms of miles traveled trended up in May compared to April, but was still down roughly 25% compared to pre-crisis benchmarks. Similarly, the U.S. Energy Information Administration projects that gas consumption for the second quarter of 2020 will be down 26% vs. 2019 levels. And the lingering travel impacts of social distancing guidelines prompted AAA to forego its annual Memorial Day travel forecast for the first time in 20 years.
Overall, May was a month of continued social distancing but slightly increased mobility – and likely more time outside the house, as the average temperature across the U.S. increased nearly 10 degrees compared to April. With that backdrop, here now is a closer look at six ways America’s viewing habits changed in May 2020:
1. TV CONTINUED TO ATTRACT LARGER AUDIENCES
The proliferation of stay-at-home orders in effect throughout April drove what likely will be the peak of TV audience increases for the foreseeable future – but May’s more moderate 1% viewership increase vs. 2019 is no less impressive, especially when considering the absence of major sports events and season finales from what typically is one of TV’s biggest months of the year. For three of every four days of the May 2020 broadcast month, the average total-day viewing audience exceeded the audience level for the corresponding day in 2019.(1)
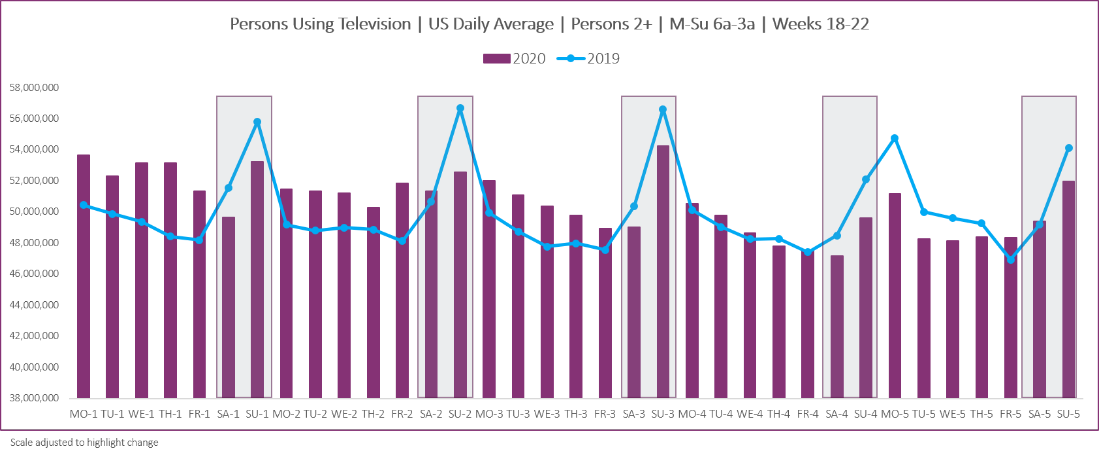
2. WEEKDAY TV VIEWING BUMPED UP FOR ALL FIVE DAYS
Breaking down the days of the week, Monday-Friday all showed audience growth in May compared to last year, with average weekday viewing levels up approximately 3% vs. 2019. Weekend viewing, meanwhile, was off about 3% vs. last year – most notably on Sundays, where May 2019 audience levels were bolstered by high-profile sports events, such as the NBA Finals and NHL Stanley Cup Playoffs, as well as the final episodes of HBO’s Game of Thrones.(2)
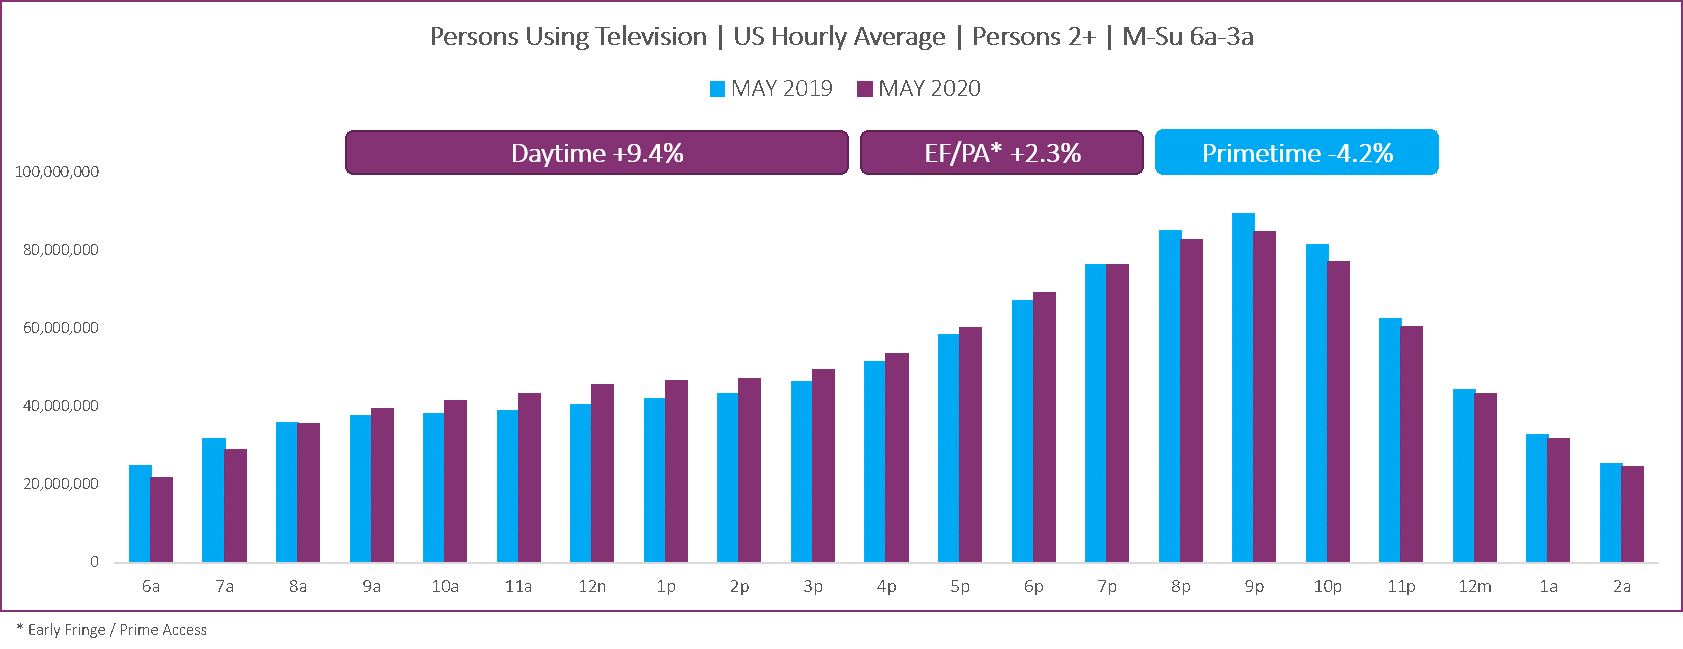
3. DAYTIME CONTINUED TO BE TV’S GROWTH DRIVER
Based on Cox Media analysis of Nielsen data, daytime viewing once again saw the biggest year-over-year lift, with average audience levels up more than 9% vs. 2019. Audience levels during the late afternoon and early evening hours continued an upward trend, as well, growing more than 2% compared to last year. Primetime viewership, meanwhile, was off slightly, down about 4% from May 2019 – which, unlike this year, featured season and series finales for multiple marquee Broadcast programs, including Empire and Big Bang Theory.(3)
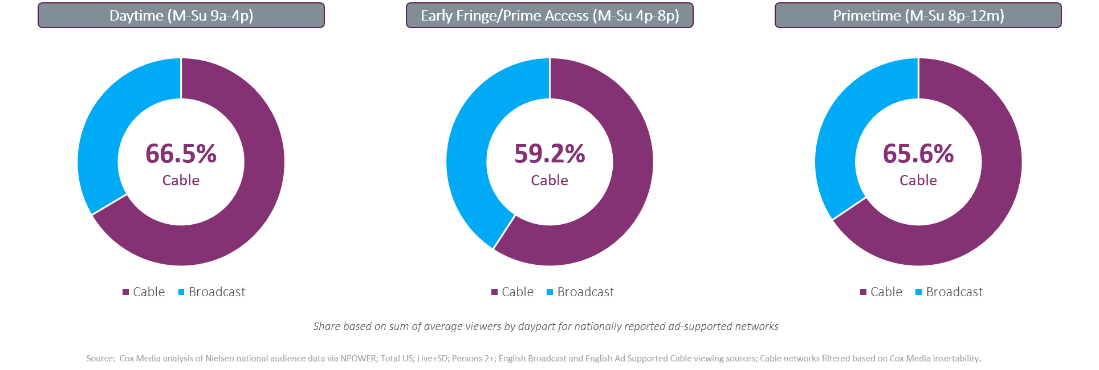
4. INTEREST IN NON-SPORTS PROGRAMMING HELPED CABLE SUSTAIN STRONG SHARE
While the ongoing and glaring absence of most live sporting events led to audience declines for Cable’s 24-hour sports networks, the remainder of the ad-supported Cable lineup added viewers at an impressive clip in May. As a result, Cable maintained a sizable advantage over Broadcast in terms of share of the ad-supported viewing audience – including nearly a two-thirds majority in primetime.(4).
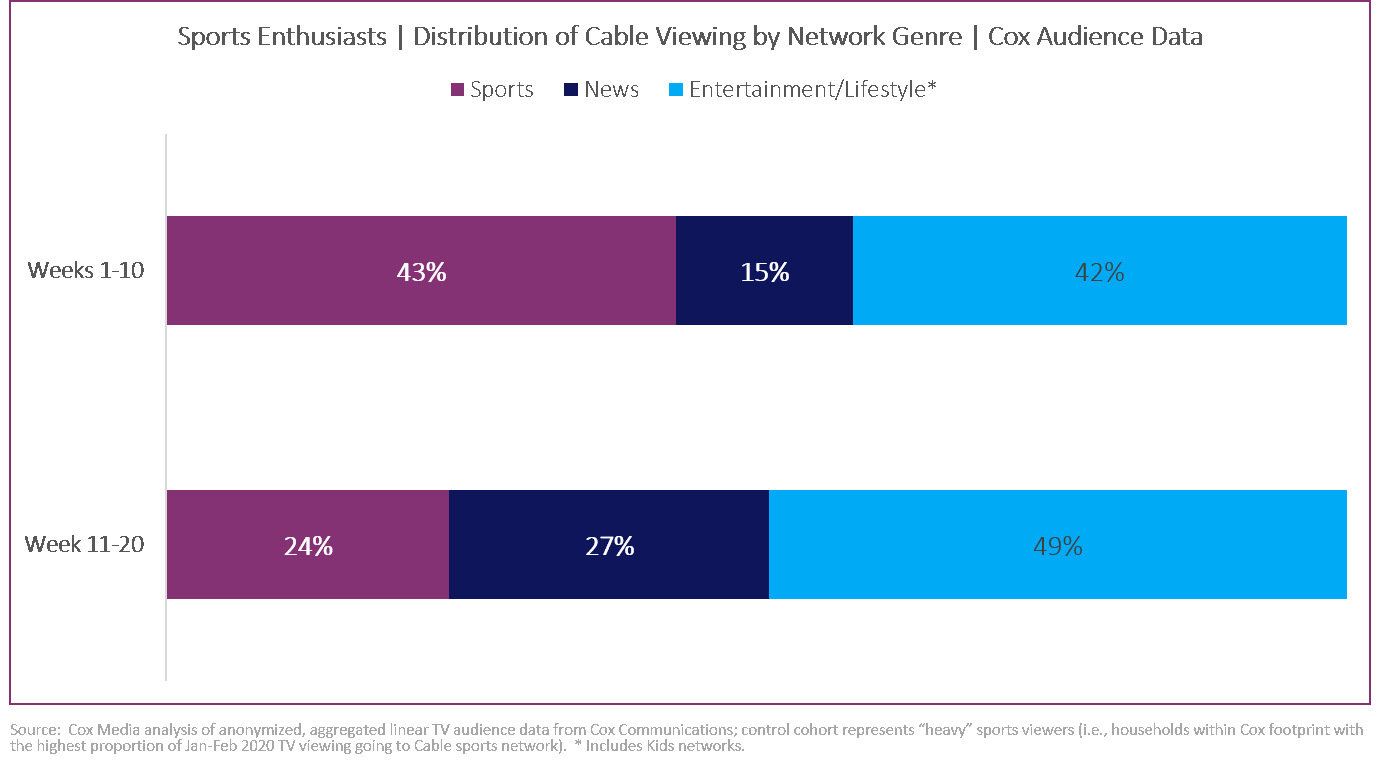
5. EVEN SPORTS VIEWERS STAYED IN THE TV GAME
A big part of Cable’s share success stems from the fact that sports viewers have not turned off their sets. In fact, based on Cox Media analysis of Cox Communications audience data, homes with the highest percentage of pre-crisis sports viewing actually are watching 5% more ad-supported Cable programming since shelter-in-place orders initially went into effect! As those sports enthusiasts watch more, the composition of their Cable viewing has shifted. Cable news networks benefitted most from the shift, garnering nearly double the share of viewing from sports enthusiasts compared to pre-crisis averages.(5)
6. STREAMING VIDEO PERSISTED IN POPULARITY
Based on Cox Media analysis of Nielsen national data, the average number of minutes U.S. households spend streaming video increased 108% in April, compared to April 2019 – an astounding growth rate that would have been nearly impossible to maintain. Still, the streaming numbers for May are quite impressive in their own right – up 75% vs. the same period last year! Comscore estimates that elevated streaming activity continues to fuel increased in-home data usage. May data usage was trending 33% above 2019 levels, down slightly from the 36% year-over-year increase Comscore reported for April.(6)
While continued growth is never guaranteed as the summer rolls around, the reconnection many Americans have made with TV and video these past couple of months has prompted market research firm eMarketer to upgrade their forecast for time spent with media. The company now projects that U.S. adults, on average, spend almost 6 hours a day watching TV and TV Everywhere content. That’s a jump of about 40 minutes per day compared to last year that is expected to hold for the remainder of 2020.
We’ll be back next month with a look at how the story unfolds in the June numbers!
Visit coxmedia.com for continuing coverage, analysis, and support.
SOURCING
- Cox Media analysis of Nielsen national people meter data via NPOWER for Weeks 18-22 of each broadcast year; Persons Using Television (PUT); Persons 2+; Live+SD; M-Su 6a-3a average. (Week 22 of 2019 was first week of June broadcast month.)
- Cox Media analysis of Nielsen national people meter data via NPOWER for Weeks 18-22 of each broadcast year; P2+ PUT; Live+SD; M-Su 6a-3a data averaged by day of week.
- Cox Media analysis of Nielsen national people meter data via NPOWER for Weeks 18-22 of each broadcast year; P2+ PUT; Live+SD; M-Su 6a-3a hourly data averaged for Daytime (9a-4p), Early Fringe/Prime Access (4p-8p), and Primetime (8p-12m).
- Cox Media analysis of Nielsen national audience data via NPOWER; Total U.S.; Live+SD; Persons 2+; English Broadcast and English Ad Supported Cable viewing sources; Cable networks filtered based on Cox Media insertability.
- Cox Media analysis of anonymized, aggregated linear TV audience data from Cox Communications; control cohort represents “heavy” sports viewers (i.e., households within Cox footprint with the highest proportion of Jan-Feb 2020 TV viewing going to Cable sports network). Weeks 1-10 represent 12/30/2019-3/8/2020; Weeks 11-20 represent 3/9/2020-5/17/2020. *Entertainment/Lifestyle includes Kids networks.
- Cox Media analysis of Nielsen national weekly streaming summary data. Comscore blog post, “How COVID-19 is Changing the Way Americans Engage With Streaming Services” (May 26, 2020).

About the Author
David Gustafson
As Cox Media’s Director of Audience Research, David drives positive outcomes for marketers by applying a unique blend of data-informed analysis, industry expertise, and storytelling skills that have earned him a tenured role as the company’s “Professor.” Specializing in audience measurement and market intelligence, David is a member of the Ampersand Cross-MVPD Research Committee, Nielsen Local Policy Guidelines Committee (PGC) and VAB Measurement Innovation Task Force, as well as client advisor to Comscore.
Connect with a Marketing Expert
Share Post On Social
Related Insights
Connect With Your Local Marketing Expert
You know your business. We know advertising. Together, we can bring your business to more people. Contact a member of our team today. We’d love to help you grow.