Audience Insights: Saying Sayonara to Summer with a Smattering of Stats
Based on the photos steadily cropping up across the social media landscape, summer is once again giving way to back-to-school season. As parents navigate the $661 per child that Deloitte researchers estimate will be spent this year on back-to-school purchases, students head back to the classroom and try to recall what they thought they used to know. That struggle is most definitely real, according to a 2020 study that found the average elementary school student loses 17–34% of the prior year’s learning over the summer break.
In that spirit of continually learning and relearning, we here at Audience Insights headquarters have compiled five stats and stories that we did not want to forget:
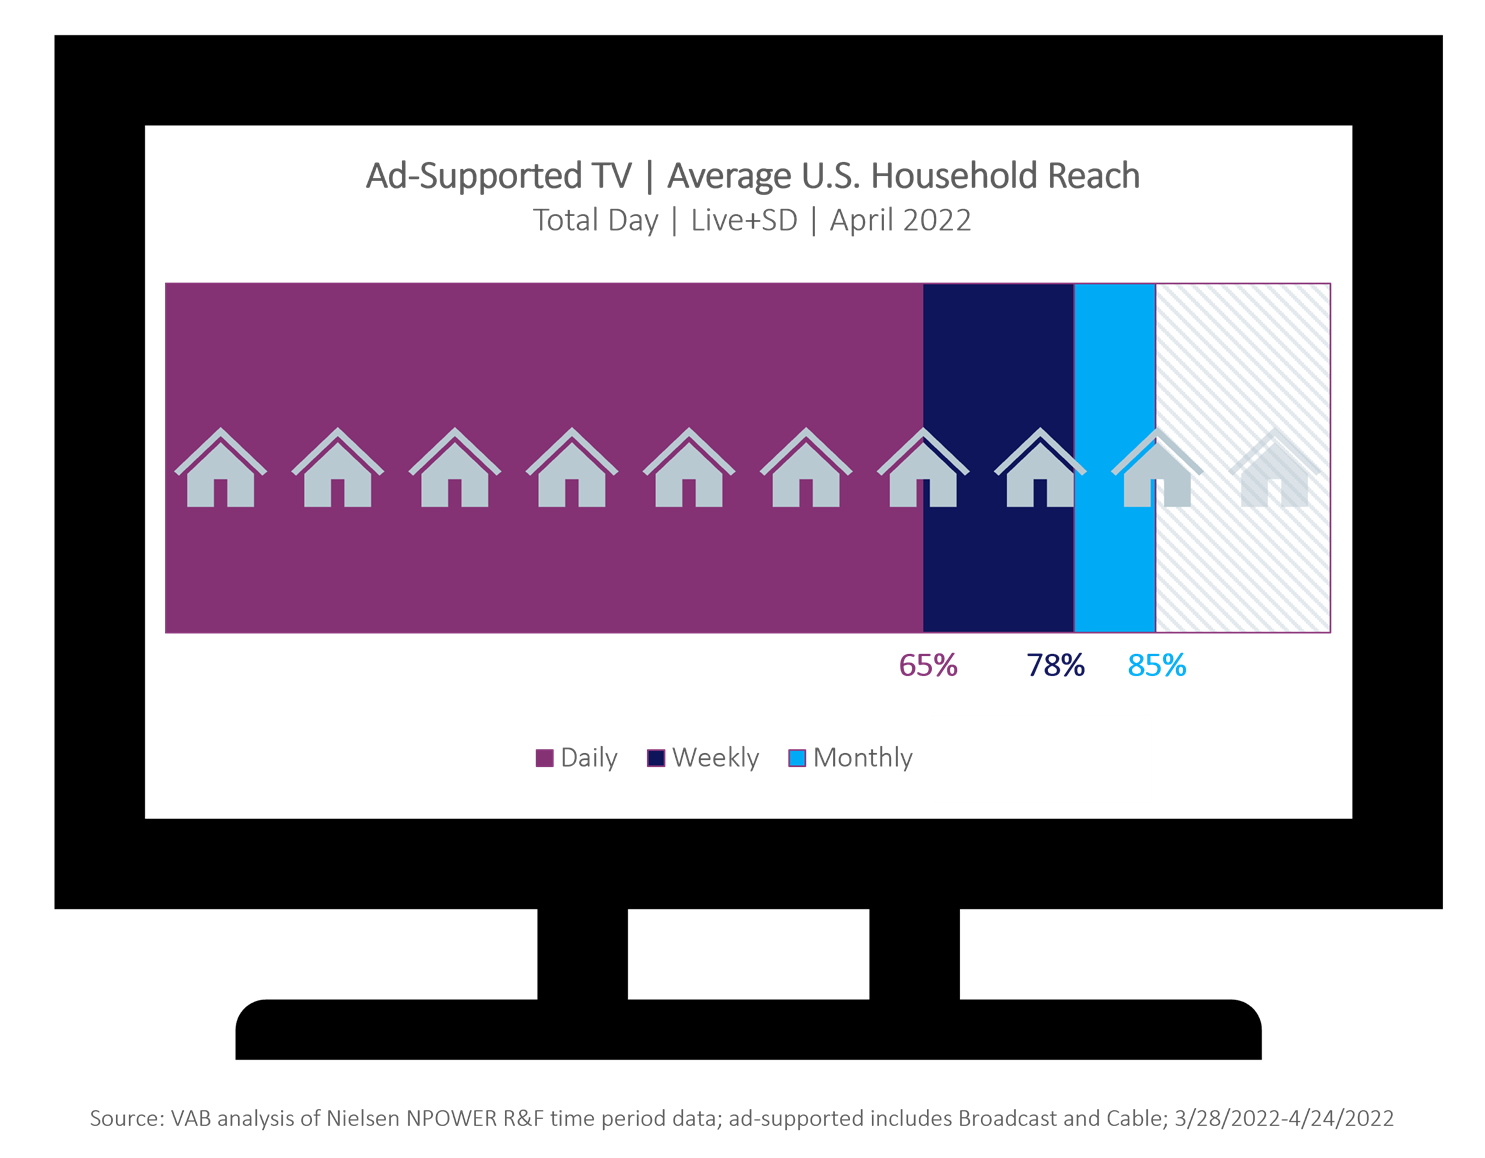
1. Ad-Supported TV Reaches 85% of U.S. Households Monthly
According to VAB analysis of Nielsen data for the April 2022 broadcast month, ad-supported Broadcast and Cable television networks combine to reach two out of three U.S. households on a weekly basis, building to a monthly cumulative reach of 85% of U.S. households.

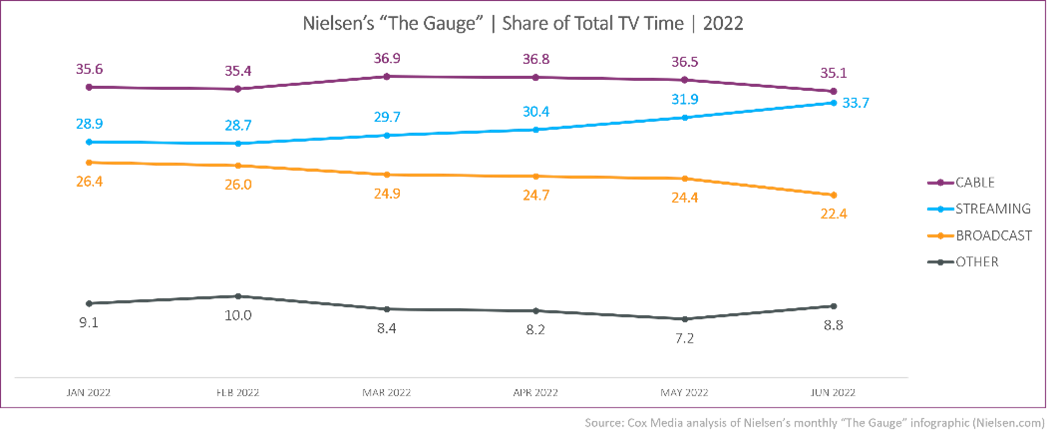
2. Streaming Surge Continues, Nearly Equaling Cable in Total TV Viewing Time
According to the latest monthly release of The Gauge, a monthly Nielsen “macroanalysis” of video consumption across major TV delivery platforms, June marked the fourth consecutive month of increased Streaming activity. Cable continued to top the TV charts, garnering 61% of “traditional” viewing time vs. 39% for Broadcast.

3. Approximately 9 of 10 Consumers Prefer “Aggregation” of Video Services
According to recently released data from Hub Entertainment Research, 91% of respondents agree that the ability to access multiple Streaming services through a single device makes for a better viewing experience. Among respondents who access Streaming services through Cable and Satellite set-top boxes, 70% believe they are getting an “excellent” or “good” value from their Pay TV subscription.
4. VOD Users More Likely to Vote in State and Local Elections
Based on Cox Media analysis of Nielsen Scarborough data, U.S. adults who have accessed video-on-demand (VOD) content in the past 30 days are more likely to “always” vote in local (112 index) and statewide (113) elections. The majority of those VOD users (56.6%) are 35-64 years of age – and nearly 40% report household incomes of at least $100,000 per year (130 index).
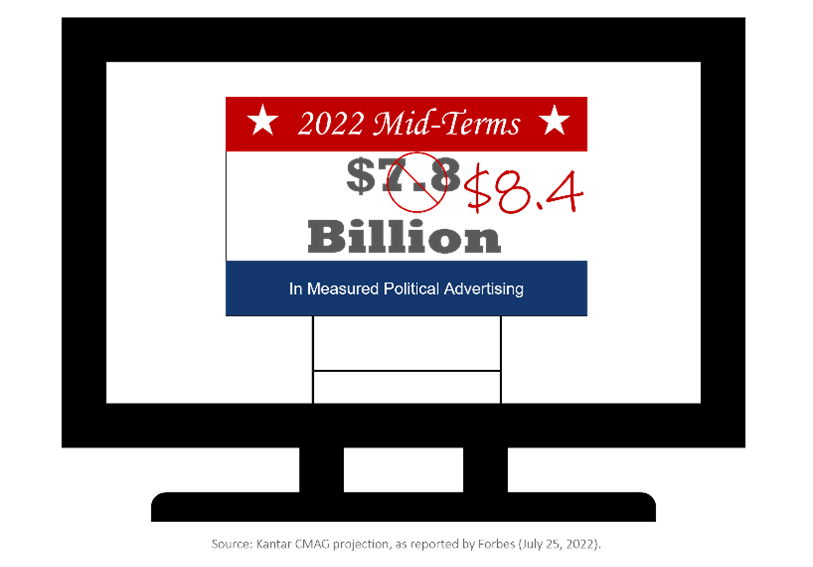
5. Political Advertising Projected to Reach $8.4 Billion This Year
As reported by Forbes, the industry analysts at Kantar have revised their forecast for U.S. ad spending tied to the 2022 mid-term elections. After an original projection of $7.8 billion was bumped up to $8 billion earlier this year, the latest revision pushes the total to $8.4 billion across a variety of TV and social platforms. That represents an estimated 55% jump vs. 2018 mid-term political spending.

Bruce Springsteen once reflected that he and his friends “learned more from a three-minute record, baby, than we ever learned in school.” We know the same is not true for a three-minute blog post, but we certainly appreciate you spending the time with us. Wherever you may be in this year’s back-to-school journey, we hope you smile thinking of your answer to the age-old question, “What did you do this summer?”
And we hope to see you back here for more Audience Insights next month. In the meantime, feel free to contact us using the Get Started button in the upper right if you have questions or suggestions on topics you would like to see us cover. Thank you!
Want more mind-blowing media info? Check out our short video series, “The Professor’s Perspective,.”
Connect with a Marketing Expert
Share Post On Social
Related Insights
Connect With Your Local Marketing Expert
You know your business. We know advertising. Together, we can bring your business to more people. Contact a member of our team today. We’d love to help you grow.


